Alerts
Alerting is integral to the Hybrid Manager (HM) Observability ecosystem, which proactively notifies about critical events that impact the performance of the Postgres cluster. It continuously monitors essential performance metrics and triggers alerts whenever predefined thresholds are exceeded. This robust alerting system integrates seamlessly into the HM ecosystem, leveraging real-time data collected from Postgres clusters and their infrastructure across all regions. Alerts are enabled by default for each project created in the HM.
The alerting system ensures timely notifications through intuitive notifications, allowing for quick and informed actions. Comprehensive alert configuration options allow specific thresholds and intervals to be configured to customize the alerting experience. This seamless integration of monitoring and alerting offers complete visibility, enabling swift responses to potential issues and maintaining optimal cluster performance.
View the Alerts
You can access the alerts on the Monitoring tab of the cluster detail page and view the alert details for a specific cluster.
For HM clusters:
- Go to Console, and on the top select Projects
- Select any project from the list
- In the left navigation, go to Clusters
- Select any cluster with a ready state
- On the Cluster detail page, select the Monitoring tab
For external HM clusters:
- Go to Console, and on the top select Estate
- Go to the table listing all the clusters
- Select a ready cluster with Management as Self-managed
- On the cluster detail page, select the Monitoring tab
The Monitoring tab displays the Active Alerts list in a table. At the top of this tab, you can view a summary of the active alerts with their severity levels set to High, Medium, and Low.
You can search for specific alerts using,
- the Search box for query-based search
- the Date Range Selector for a specific date range-based search
- the Filter for a severity level-based search
- the Sort utility, you can sort the alerts list based on severity, alert start time, and alert name
- the Refresh button, to refresh the alerts list
- the Column Selector dropdown, you can select the columns to be displayed in the table according to your preferences
- the Download button, to download the alerts list in a CSV format
You can use the Refresh button to manually refresh the alerts. The last refresh interval is displayed at the bottom of the alert table.
Select any nodes in the Node column to view the charts as they were when the alert was triggered. Selecting a node automatically applies the filters in the Monitoring tab and displays the relevant charts.
Download CSV — You can download the alert details in CSV format using the Download button in the top-right corner. The CSV file includes these columns:
- Alert Description
- Start Time
- Alert Severity
- Metric Triggering the Alert
- Node on which the alert has occurred
- Alert Threshold
- Cluster ID
- Project ID
Configure Alerts
Alerts can be configured at the project level. The project admins can configure the alerts. Once the alerts are configured and applied, the system requires a few minutes to fully process the alerts.
To configure alerts:
- Sign in to the EDB Postgres AI Console.
- On top of the console, Select Projects
- Select any project from the list
- In the left navigation, go to Setting
- Select Alerts to access/edit the alerts configuration
For each alert, select the Edit button, to:
- Enable/Disable — To activate or deactivate a specific alert as required
- Notify After — To set the time duration after which the alert is triggered
- Threshold — To specify the percentage or values that will trigger an alert when they are exceeded.
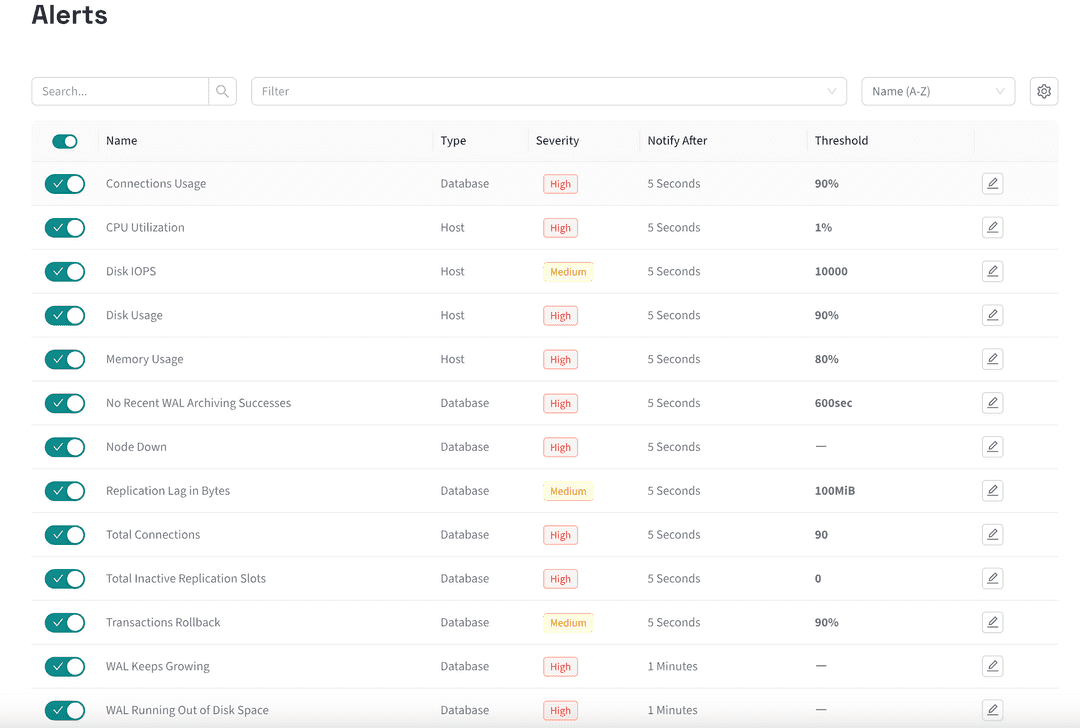
The list of the alerts with the default configuration:

The alerts that can be configured at database level:
- Connections Usage
- No Recent WAL Archiving Successes
- Node Down
- Replication Lag in Bytes
- Total Connections
- Total Inactive Replication Slots
- Transactions Rollback
- WAL Keeps Growing
- WAL Running Out of Disk Space
The alerts that can be configured at host level:
- CPU Utilization
- Disk IOPS
- Disk Usage
- Memory Usage
Note
- Any changes made to the alert configuration are saved automatically.
- All the alerts are not available for external HM clusters due to the technical limitations of making them available.
- On this page
- View the Alerts
- Configure Alerts
← Prev
Notifications
↑ Up
Monitoring with Hybrid Manager
Next →
PGAIHM High Availability & Disaster Recovery (HA/DR)
Could this page be better? Report a problem or suggest an addition!